
Engineering teams usually know which service is unhealthy before they know which customers are affected. Infrastructure telemetry can show latency, errors, saturation, and dependency failures, yet it rarely answers the operational question directly: who cannot complete what, in which market or tenant, and since when?
Customer impact analysis closes that gap. It connects production topology and change events to business capabilities, journeys, cohorts, and observable outcomes. Done well, it improves release gates, incident prioritization, communication, and recovery verification without hiding the underlying technical evidence.
Customer impact is more than an error count
A raw error total mixes very different experiences. One thousand retried background requests may be less urgent than ten blocked payment confirmations. A global availability percentage can remain healthy while every user in one country, plan, device version, or regulated tenant is unable to finish a critical journey.
Describe impact across explicit dimensions:
- Journey: the customer intent, such as sign in, checkout, transfer, search, upload, or dispatch.
- Cohort: tenant, plan, region, device, account type, feature eligibility, or traffic stage.
- Failure mode: unavailable, degraded, delayed, incorrect, duplicated, or silently incomplete.
- Duration: first exposure, continuing exposure, recovery time, and delayed downstream effects.
- Magnitude: exposed customers, failed attempts, affected transactions, or unavailable capacity.
- Criticality: safety, money movement, data integrity, contractual commitments, or a recoverable inconvenience.
Keep both views: “payment API error rate is 3.2%” is technical evidence. “412 customers could not confirm an order in the last 15 minutes” is customer impact. Neither statement replaces the other.
Build a causal model from change to journey
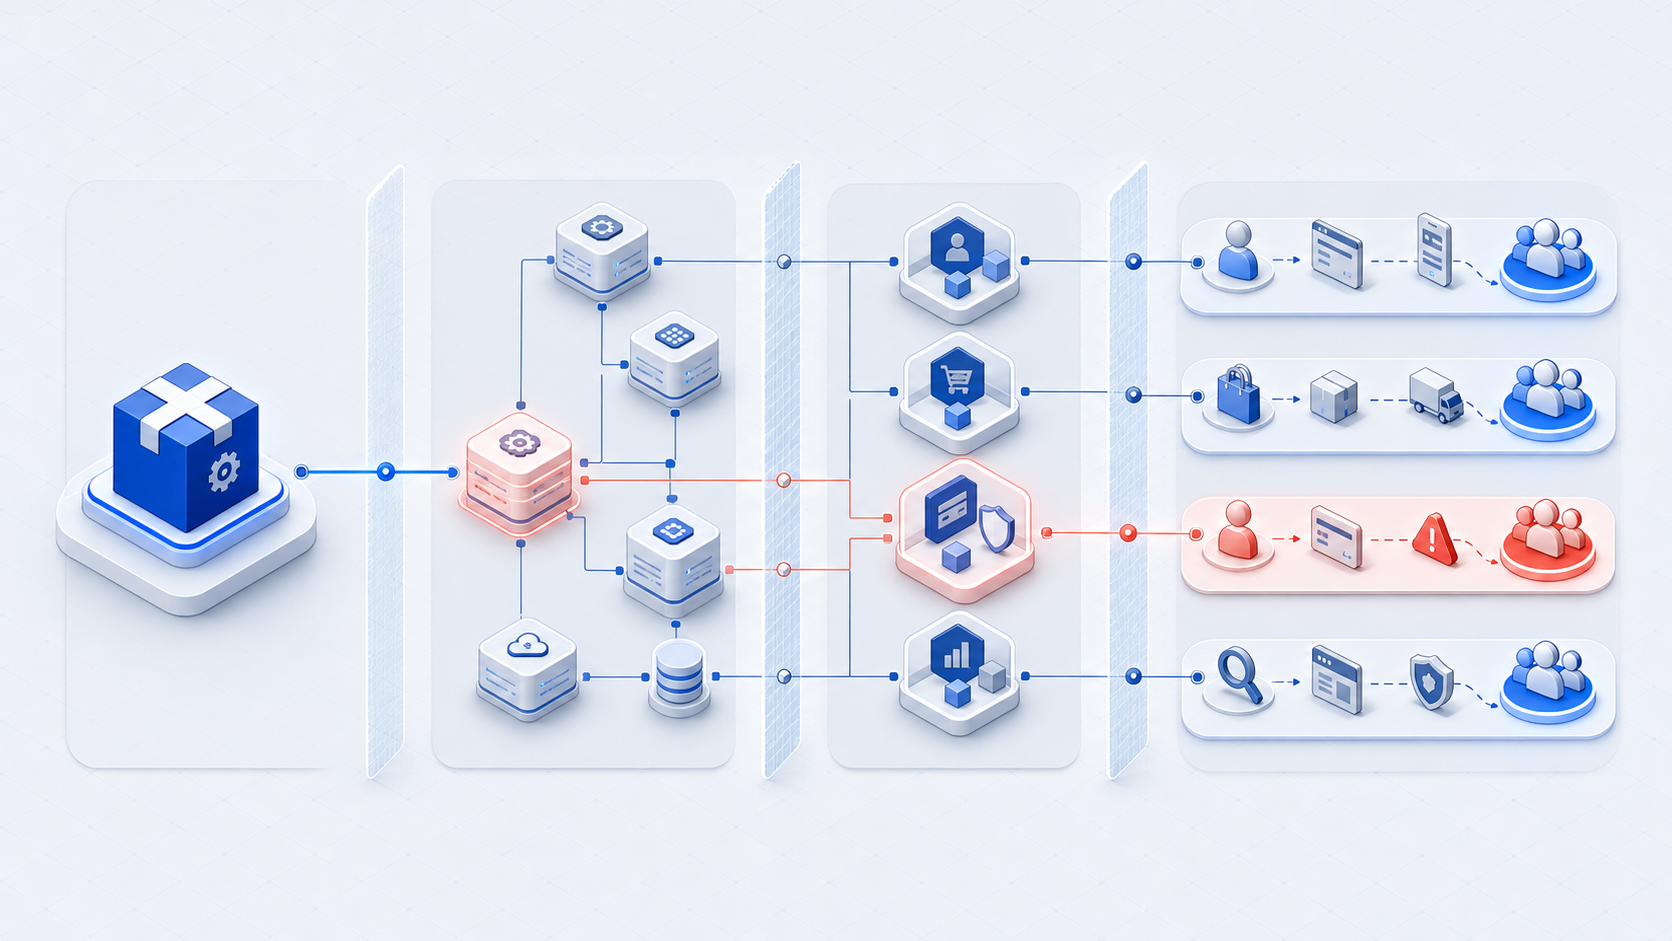
Start with a directional production graph. Application services, APIs, queues, cloud resources, databases, schemas, configuration, flags, regions, and external providers form the technical layer. Business capabilities and customer journeys form the outcome layer.
Map each journey to the capabilities and technical paths it needs. The map should represent alternate paths, graceful degradation, asynchronous work, and durable data effects. A search journey may tolerate delayed indexing; an account balance cannot tolerate an incorrect write even if the page still loads.
Attach ownership and confidence to every relationship. A manually asserted journey dependency is useful, but runtime traces, gateway routes, event schemas, database lineage, feature evaluations, and synthetic transactions can strengthen or challenge it. Conflicting evidence should lower confidence, not disappear.
Define exposure before measuring harm
Exposure is the set of customers who can reach the changed or unhealthy path. Actual impact is the subset that experiences a negative outcome. Keeping them separate prevents false precision.
For a staged release, exposure may begin with internal accounts, expand to one region, then reach a percentage of eligible traffic. A feature flag may expose only selected tenants. A database migration may reach every application version that writes to the table even if application traffic is canaried.
Use eligibility and routing evidence whenever possible: flag evaluations, rollout assignments, region and cell placement, tenant-to-shard mapping, API routes, client versions, and the time boundaries of the change. When exact identity is unavailable or inappropriate, use privacy-preserving aggregate cohorts.
Choose signals that represent the journey
Customer-impact signals should sit close to a meaningful outcome. Combine several signal types:
- Journey telemetry: completion, abandonment, retries, time to complete, and step-level failure.
- Business events: accepted orders, authorized payments, created shipments, delivered messages, or settled transfers.
- Experience signals: client crashes, page responsiveness, device errors, and support contact volume.
- Data correctness: reconciliation gaps, duplicates, invalid transitions, stale projections, and repair queues.
- Synthetic checks: controlled transactions that verify a critical path from the customer edge.
Define a baseline by cohort and time pattern. A 20% drop at midnight may be normal; a 2% drop during a high-value business event may be material. Compare with suitable control groups when a rollout provides them, but check for shared dependencies that can affect both control and treatment.
Use customer impact in release decisions
Before a release, predict exposed journeys and cohorts from the change boundary and dependency graph. Use that prediction to choose the initial stage, the observation window, the health signals, and the recovery action.
- Record the exact artifacts, configuration, infrastructure, schema, and flags changing together.
- Traverse dependencies to capabilities and customer journeys.
- Apply the planned region, cell, tenant, flag, or traffic scope.
- Bind stage gates to both technical and journey-level indicators.
- Pause expansion when evidence is incomplete; stop or recover when thresholds are breached.
Do not wait for a global KPI to move. Small canaries often cannot produce statistically strong business metrics. Use leading technical evidence, high-sensitivity journey checks, and a defined maximum observation time together.
Use customer impact during incidents
At incident start, produce a bounded statement with confidence: suspected journeys, earliest exposure, current cohorts, observed outcome, and evidence still missing. Update it as the dependency model and telemetry converge. This gives responders and communicators one evolving source of truth.
Prioritize containment based on criticality and propagation, not only request volume. Stopping a corrupting write can be more important than restoring a read path first. Track delayed work, retries, caches, and downstream data so “service recovered” does not prematurely become “customers recovered.”
Verify recovery at the outcome layer. Error rates returning to baseline do not prove that queued jobs completed, data reconciled, or every affected cohort regained access.
Avoid misleading shortcuts
- One universal KPI: aggregate health conceals localized or low-volume critical failures.
- Static journey maps: architecture and ownership change; refresh relationships from production evidence.
- Correlation presented as causation: time alignment is a lead, not proof. Preserve competing explanations.
- Counting only visible failures: silent corruption and delayed work can create the longest impact.
- Unsafe customer identity joins: minimize data, control access, and prefer aggregates where individual identity is unnecessary.
- Ending at rollback: recovery may require replay, reconciliation, cache repair, or direct customer support.
A mature model lets an engineering team move from “a service is red” to a defensible decision about exposure, urgency, communication, and complete recovery. That is the point of customer impact analysis: make production decisions around real outcomes while keeping every conclusion traceable to technical evidence.