
A deployment risk score should estimate the chance that a change produces an unacceptable outcome and the consequence if it does. The number is useful only when its contributing evidence is visible and it leads to an appropriate release decision.
There is no universal formula that works unchanged for every system. A payments platform, an internal analytics tool, and a consumer mobile backend have different failure costs and recovery constraints. The framework below is deliberately adaptable.
Define risk before scoring it
Deployment risk is not the same as change size. A one-line permission change can expose a critical resource, while a large refactor behind a disabled feature flag may expose nobody. Start with two questions: how likely is the change to cause degradation, and how severe would that degradation be?
A third dimension, recoverability, changes the practical consequence. Two changes may have equal probability and impact, but the one with a fast, tested, low-data-loss recovery path deserves a different operating response.
Working model: risk increases with failure probability and impact, and decreases as detection quality, exposure control, and recovery confidence improve.
A practical scoring model
Use a 0–100 score because it is easy to compare, but preserve the raw factors. One approach is to calculate three sub-scores and then apply mitigating controls:
- Failure probability, 0–40: change novelty, complexity, test gaps, historical failures, and coupling.
- Potential impact, 0–40: service criticality, blast radius, customer exposure, data risk, and security boundary.
- Operating conditions, 0–20: timing, concurrent changes, staffing, observability, and environment drift.
- Mitigation credit, 0 to −25: canary isolation, automatic health gates, tested rollback, and reversible feature controls.
Clamp the result to 0–100 and map ranges to local risk tiers. Do not let a mitigation fully erase a critical hazard; some factors should set a minimum score or mandatory policy regardless of the total.
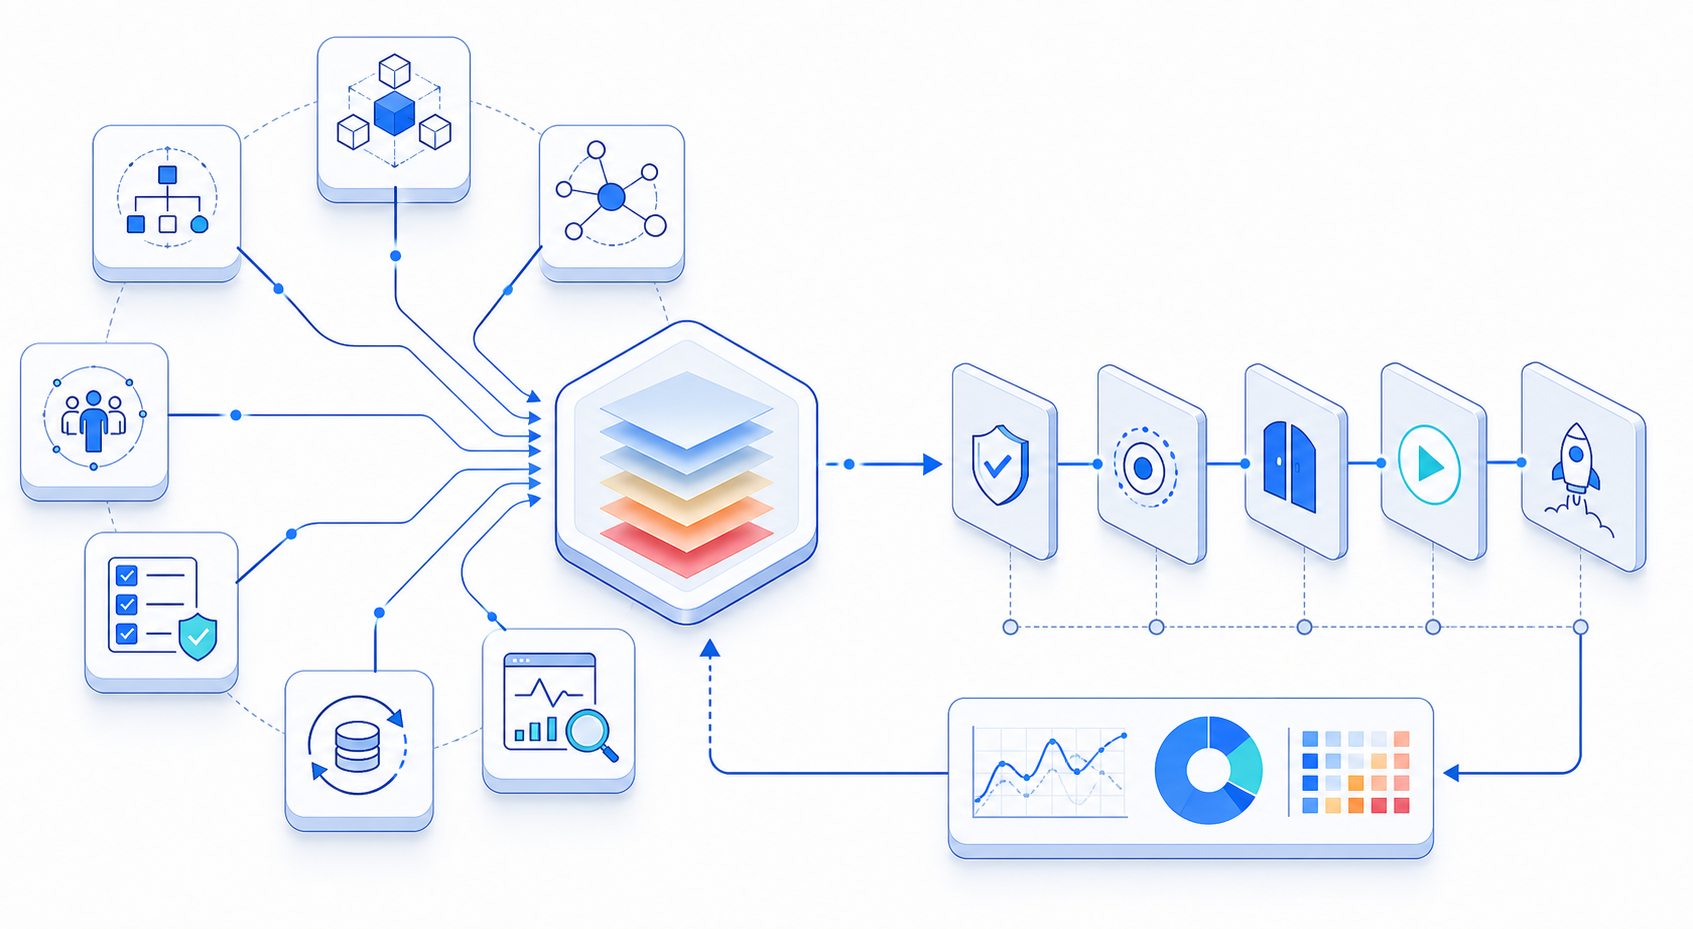
Factors worth measuring
Change characteristics
Consider modified components, configuration sensitivity, new dependencies, deployment mechanism, schema operations, infrastructure replacement, permission scope, and whether the change introduces unfamiliar technology. Diff size can contribute, but it is a weak proxy on its own.
Dependency and blast-radius context
Score critical upstream callers and downstream dependencies, shared data stores, synchronous request chains, regional scope, and multi-tenant exposure. A central identity service or shared database should carry more impact weight than an isolated worker.
Historical evidence
Use recent failure frequency for the service, change type, repository, owning team, and release mechanism. Apply time decay so old incidents matter less as systems and practices improve. Avoid using history to punish teams; the signal is for allocating safeguards.
Verification quality
Look for relevant test results, production-like validation, observability coverage, baseline stability, and explicit health thresholds. A green test suite is stronger when the tests exercise the changed behavior and the deployment environment resembles production.
Recovery readiness
Confirm that the artifact can be restored, database compatibility is understood, configuration versions are retained, traffic can shift, and responsible people know the trigger. “Rollback available” should not receive full credit unless it has been tested for this change class.
Worked example
Assume a checkout service release introduces a new database index and changes retry behavior. It affects one region initially, runs during normal traffic, and has a tested application rollback. The schema operation cannot be instantly reversed.
- Probability: 22/40 because the retry path is new and the migration touches a busy table.
- Impact: 31/40 because checkout is revenue-critical and shares the database with two services.
- Operating conditions: 9/20 because telemetry is strong but traffic is significant.
- Mitigation: −12 for a 2% canary, query-latency gates, and tested application rollback.
The resulting score is 50. The model may classify that as medium, but a database-risk policy can still require preflight lock analysis and an explicit stop condition. The score informs the workflow; it does not replace policy.
Map risk tiers to release controls
A score matters when it changes how the release proceeds. Keep the control matrix simple and publish it.
- Low: automated policy checks, standard monitoring, normal release path.
- Moderate: limited initial exposure, named health criteria, verified rollback, and service-owner review.
- High: smaller stages, longer observation, cross-functional approval, staffed release window, and rehearsed recovery.
- Critical: explicit executive or incident-command awareness, isolated environment or tenant cohort, and a documented go/no-go review.
Overrides should be possible for emergencies, but the person, reason, evidence, expiration, and follow-up must be recorded.
Calibrate with real outcomes
Record whether each deployment caused an incident, rollback, threshold breach, customer impact, or manual intervention. Compare predicted risk with actual outcomes. If high-scored changes almost never fail, the model may be noisy. If low-scored changes cause most incidents, it is missing important signals.
Review false positives and false negatives separately. Adjust one factor at a time, version the model, and test it against historical releases before changing live policies. Calibration should improve ranking and control selection, not merely force scores toward a preferred average.
Common scoring mistakes
- Treating lines changed as the dominant factor.
- Hiding a score behind an unexplained machine-learning output.
- Letting teams manually select their risk tier without evidence.
- Using the same weights for databases, infrastructure, permissions, and application code.
- Ignoring customer exposure, timing, or concurrent changes.
- Reducing risk because a rollback button exists, without verifying recovery semantics.
- Never comparing predictions with outcomes.
A trustworthy deployment risk model is transparent, outcome-aware, and connected to action. Its strongest output is not the number itself, but a clear explanation of why the change is risky and which controls will reduce that risk.