
Most organizations already have several dependency maps. Teams draw architecture diagrams, service catalogs list declared relationships, cloud inventories expose resources, tracing shows request paths, and data platforms document lineage. The problem is not the complete absence of information. It is that the information is fragmented, differently scoped, and often stale when a production decision is urgent.
Production dependency mapping creates an operational model from that evidence. It helps answer concrete questions: what can this change affect, which teams own the reachable systems, which health signals matter during rollout, and what must recover together after failure?
Design the map around decisions
A map built only to visualize architecture tends to become a wall of nodes. Start with the decisions it must support. Release risk needs change-to-service and service-to-customer reachability. Incident response needs directional failure propagation, owners, and recovery order. Audit evidence needs the relationship between an approved change and the production resources it modified.
Different questions can use the same graph, but they may traverse it differently. An API call is directional. A shared cluster creates a common failure domain. A schema relationship may propagate incompatibility backward to older application versions. A queue can delay rather than synchronously fail work. Preserve these semantics instead of flattening every relationship into “connected to.”
A graph is an operational hypothesis. Every node and edge should carry its source, observation time, confidence, and owner so teams can challenge and improve it.
Model entities that change or carry impact
A practical model usually spans several layers:
- Change artifacts: commits, builds, images, packages, configuration versions, migrations, policies, and feature flags.
- Application topology: services, APIs, workers, jobs, functions, gateways, events, and client applications.
- Infrastructure: accounts, regions, clusters, networks, load balancers, queues, compute, storage, and identity resources.
- Data: databases, schemas, tables, streams, indexes, replicas, analytical models, and retention paths.
- Operations: teams, repositories, runbooks, on-call schedules, service objectives, and recovery mechanisms.
- Outcomes: business capabilities, customer journeys, tenants, cohorts, and critical events.
Use stable identities rather than display names alone. A service renamed in a catalog, a resource recreated in another account, and a database with the same name in two regions must remain distinguishable. Record environment and time because the topology that existed during yesterday’s incident may differ from today’s.
Combine declared and observed evidence
Declared relationships explain intent
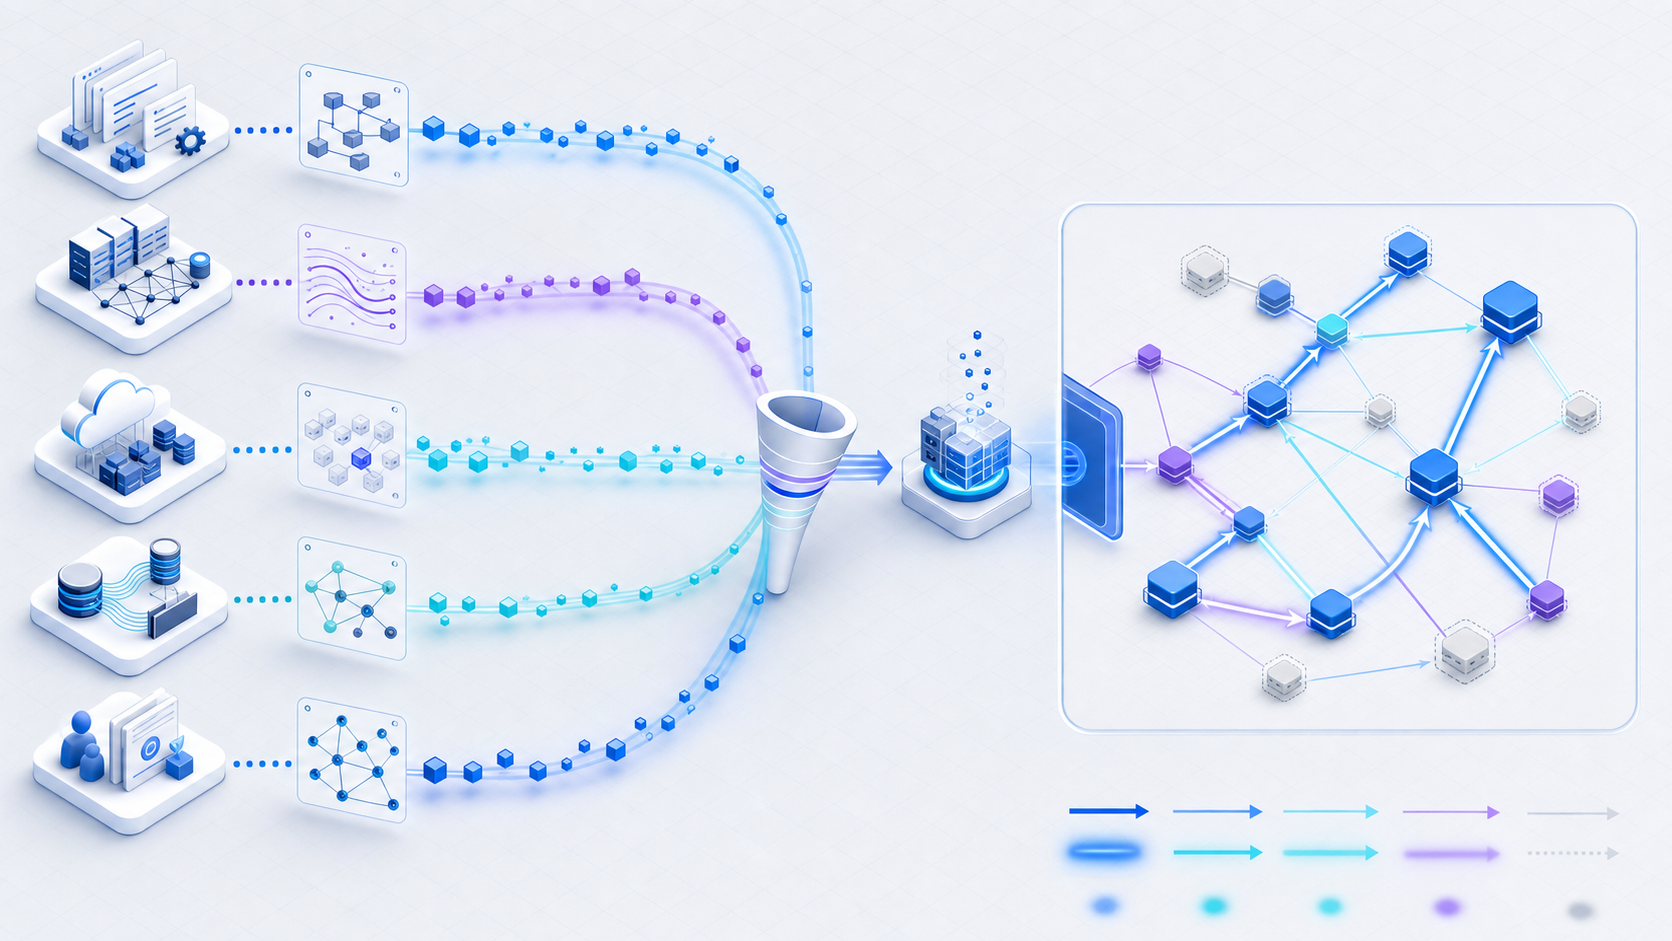
Service catalogs, infrastructure-as-code, deployment manifests, API specifications, event schemas, database metadata, repository configuration, and ownership files describe how teams expect the system to work. These sources are structured and often available before a new path receives production traffic.
Observed relationships explain reality
Distributed traces, gateway access, network flows, message telemetry, database clients, cloud control-plane events, feature evaluations, and synthetic journeys show what actually happened. They reveal conditional routes, forgotten consumers, unexpected cross-region calls, and dependencies created outside the declared path.
Human knowledge explains exceptions
Teams know about planned deprecations, emergency bypasses, batch windows, external contractual dependencies, and recovery constraints that machines may not infer. Capture this knowledge as a sourced assertion with an owner and expiry, not an undocumented permanent override.
Treat every edge as structured data
An edge should say more than two things are related. Store its direction, type, environment, discovery source, first and last observation, confidence, protocol or data mode, and criticality. Useful relationship types include calls, publishes, consumes, reads, writes, routes to, runs on, shares failure domain, owned by, deployed from, and enables journey.
Direction determines propagation. If checkout calls payments, payment failure can affect checkout, while checkout failure does not necessarily affect independent payment consumers. Data writes can propagate consequences long after the original request. Shared infrastructure may connect services through capacity or identity even when no request travels between them.
Model multiplicity and alternatives. A client may use one of several regions, a worker may consume from two queues, or a journey may fall back to cached data. Without this context, reachability can overstate the blast radius and understate the recovery options.
Make freshness and confidence visible
Topology is time-sensitive. Runtime evidence may become stale when a seasonal job has not executed recently. Declared configuration may describe a path not yet released. A service catalog relationship may remain after decommissioning.
Assign confidence from evidence rather than source reputation alone. A relationship declared in code and observed recently in production may be high confidence. An operator assertion with an expiry can also be high confidence. An old trace seen once should remain visible but uncertain.
- Decay confidence as observation age exceeds the expected traffic cycle.
- Retain historical validity windows instead of overwriting the graph.
- Flag conflicts where declared and observed directions disagree.
- Expose unknown ownership and missing telemetry as risk signals.
- Let teams confirm or reject relationships with a recorded reason.
Use the map inside operational workflows
Before a release
Start from every changed artifact and traverse reachable production entities. Attach owners, customer journeys, recent incidents, concurrent changes, and recovery readiness. Use the result to select rollout stages and monitoring signals.
During rollout
Refresh exposure as traffic, regions, cohorts, and feature eligibility expand. Watch the changed component and the critical dependencies inside the predicted radius. New runtime edges should update the decision context rather than wait for a catalog review.
During an incident
Compare the affected subgraph with recent change records. Traverse upstream to discover customer entry points and downstream to discover data or infrastructure consequences. Route response tasks to current owners and verify recovery across the entire impacted path.
After recovery
Compare predicted and observed impact. Missing nodes and incorrect edges are concrete model improvements. Preserve the graph as it existed during the event so the investigation remains reproducible.
Build coverage incrementally
- Choose one critical journey. Define the production decision the first map must improve.
- Ingest authoritative basics. Start with service identity, ownership, deployment, infrastructure, and data resources.
- Add runtime evidence. Focus on directional calls, events, and shared failure domains along that journey.
- Measure gaps. Track unknown owners, low-confidence edges, unobserved declared paths, and unmapped production changes.
- Embed the graph. Put impact views in release review and incident response rather than launching a separate documentation destination.
- Expand by value. Add the next journey, region, or platform where the graph will change a decision.
Success is not the number of nodes. Measure how often the map identifies an owner, predicts affected scope, selects a useful health signal, reveals an unexpected dependency, or shortens a recovery decision. A smaller trusted graph inside the workflow is more valuable than a complete-looking diagram nobody uses.